April 21 2023
7 min read

May
2-D and 3-D models are visual ways of representing stakeholder relationships and their level of importance and influence in a project.
A stakeholder map is a useful tool because it helps in identifying and prioritizing stakeholder relationships and developing effective engagement strategies to manage stakeholder expectations and support project success.
In these models, you plot stakeholders on a two-dimensional grid. The X-and Y-axis can be made to represent power, interest, influence, impact, etc.
Some popular examples of 2-D stakeholder mapping models include:
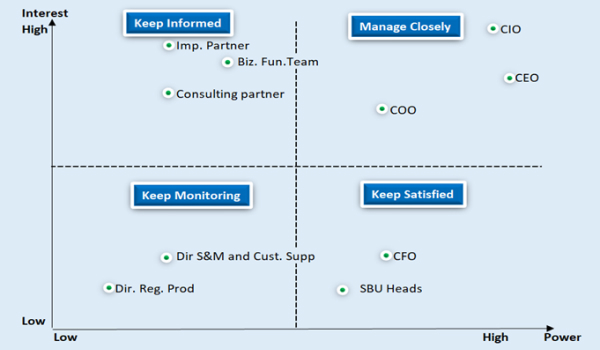
This model plots stakeholders based on their power and interest levels in the project. This results in four categories of stakeholders: high power/high interest, high power/low interest, low power/high interest, and low power/low interest. The high power/high interest stakeholders are considered the most important and require the most attention.
This model plots stakeholders based on their level of influence or importance and their level of impact or concern. The level of influence or significance is based on the stakeholder’s ability to affect the project, while the level of impact or concern is based on the degree to which the project affects the stakeholder. The most important stakeholders are those who are high in both attributes.
This model plots stakeholders based on their level of interest and ability to influence the project. Interest refers to the level of concern exhibited by the stakeholder’s involvement, while ability refers to the stakeholder’s capacity to influence the project. The most important stakeholders are those who are high in interest and ability.
This model plots stakeholders based on their level of impact on the project and their level of influence over the project. Here impact refers to the extent to which the stakeholder is affected by the project, while the level of influence refers to the extent to which the stakeholder can influence the project. This model helps identify stakeholders who are critical to the project’s success.
This model plots stakeholders based on their level of power or influence and their attitude toward the project. The level of attitude refers to the stakeholder’s positive or negative feelings towards the project, which is exhibited by the extent of support or resistance. This model helps to identify stakeholders who may need to be convinced to support the project.
Now, let’s look at one of these models (Power-Interest grid) more closely.

Low Power/Low Interest – MONITOR (watch or keep an eye. Least effort is to be spent on these)
Low Power/High Interest – KEEP INFORMED (share information frequently, as their interest level is high, they are expected to be curious to know what’s happening in the project)
High Power/Low Interest – KEEP SATISFIED (as they are very powerful, we may not be able to discard their needs)
High Power/High Interest – MANAGE CLOSEY (these are the highest stakeholders, we need to work very closely with them, constantly engage, build consensus, etc.)
This model builds upon the 2D model by adding another dimension (Z-axis) to represent stakeholders’ level of support or resistance towards the project. This results in eight categories of stakeholders as compared to 4 categories obtained from 2-D models.
Some popular examples of 3-D stakeholder mapping models include:
This model plots stakeholders based on their level of influence or importance, their level of impact or concern, and their level of support or resistance towards the project. The level of support or resistance refers to the extent to which the stakeholder supports or opposes the project. The most important stakeholders are those who have high levels of influence, high levels of impact, and high levels of support or resistance.
This model is similar to the power-interest grid but adds a third dimension for support or resistance. It plots stakeholders based on their level of power or influence, interest in the project, and level of support or resistance towards the project. The most important stakeholders are those who have high levels of power, high levels of interest, and high levels of support or resistance.
This model plots stakeholders based on their level of power, their dynamics with other stakeholders (i.e., whether they collaborate or compete with others), and their level of support or resistance towards the project. The most important stakeholders are those with high levels of power, positive dynamics with other stakeholders, and high levels of support or resistance.
This model plots stakeholders based on their level of urgency (i.e., the need for immediate attention), their level of importance to the project, and their level of support or resistance towards the project. The most important stakeholders are those with high levels of urgency, high levels of importance, and high levels of support or resistance.
Also Read: What is a risk in project management
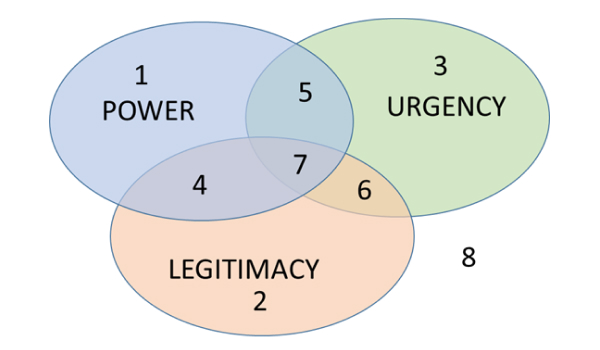
This is a popular framework used for stakeholder mapping and analysis, which uses three factors: power, legitimacy, and urgency. Stakeholders with high power, legitimacy, and urgency levels are considered the most salient and should receive the most attention and resources from the project.
Let’s look at the Salience Model a bit more closely:
Power refers to a stakeholder’s ability to influence the outcome of a project. This could be based on their position within an organization, expertise, financial resources, or access to key decision-makers.
Urgency refers to the degree to which a stakeholder’s needs or concerns require immediate attention or action. Urgent stakeholders may be experiencing a crisis or facing imminent threats, requiring prompt and decisive action.
Legitimacy refers to a stakeholder’s perceived right to be involved in the project. This may be based on their status as a member of a community, their representation of a particular interest group, or their expertise or experience in a relevant field.

Dormant
Discretionary
Demanding
Dominant
Dangerous
Dependent
Definitive
Non-stakeholder
To apply the Salience Model to stakeholder engagement, one has to do the following exercises:
Identify stakeholders: Identify all stakeholders who may be affected by the project.
Assess power, urgency, and legitimacy: Assess each stakeholder’s level of power, urgency, and legitimacy concerning the project.
Prioritize stakeholders: High-priority stakeholders have high levels of power, urgency, and legitimacy, while low-priority stakeholders have low levels of power, urgency, and legitimacy.
Develop engagement strategies: Develop tailored engagement strategies for each stakeholder based on their priority level. High-priority stakeholders may require more direct, proactive, and frequent communication, while low-priority stakeholders may require less attention.
Lastly, let’s look at a more complex stakeholder mapping exercise adopted in large projects or programs with many stakeholder groups – a “Stakeholder Network Analysis.”
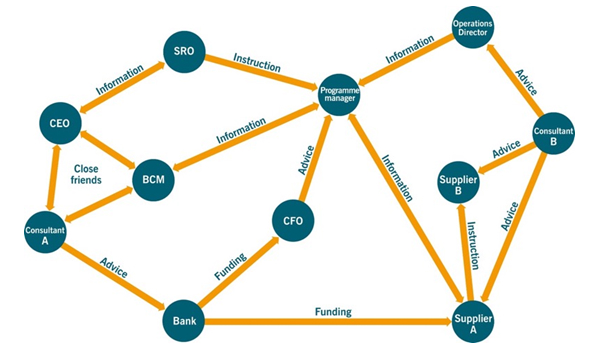
Stakeholder network analysis is a stakeholder mapping model focusing on stakeholder relationships and connections. It goes beyond identifying the individual stakeholders and their characteristics and examines how they interact and influence each other.
By analyzing the stakeholder network, organizations can better understand the dynamics of their stakeholder environment. They can identify key stakeholders who may be influential in the network and potential areas of conflict or collaboration.
The following diagram shows the stakeholders as nodes, with lines or arrows representing their relationships. The strength and direction of the relationships can be represented through different types of lines or arrows.

Source: Managing Successful Programmes, 5th edition

April 21 2023
7 min read

April 18 2023
3 min read

March 8 2023
3 min read

March 7 2023
6 min read